see System Quirks
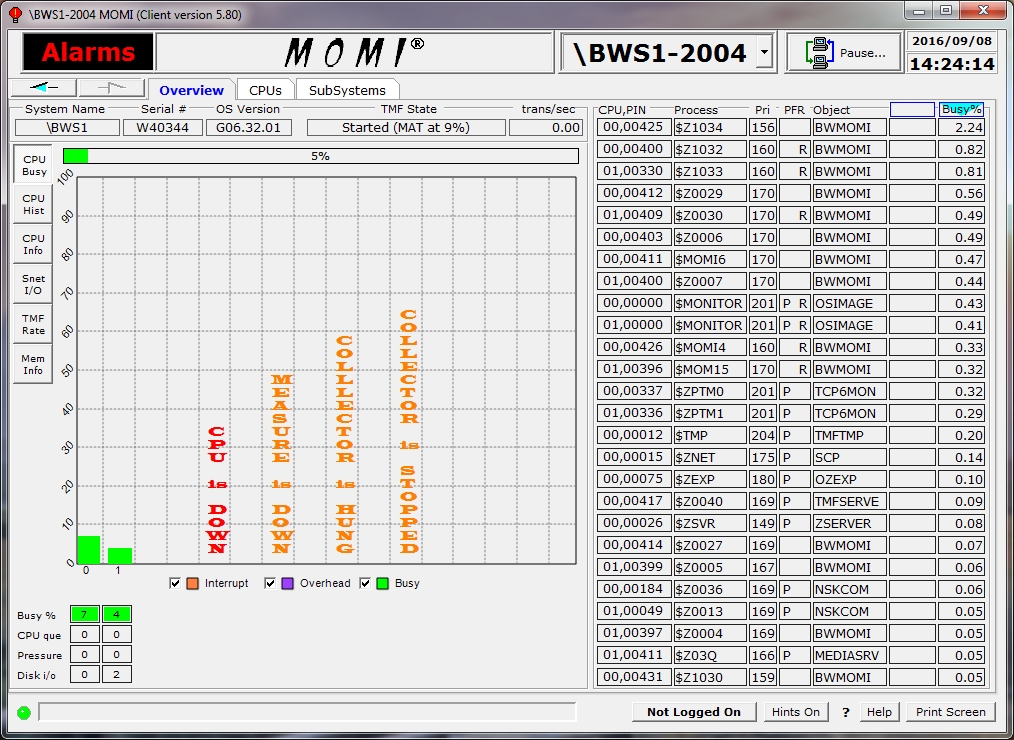
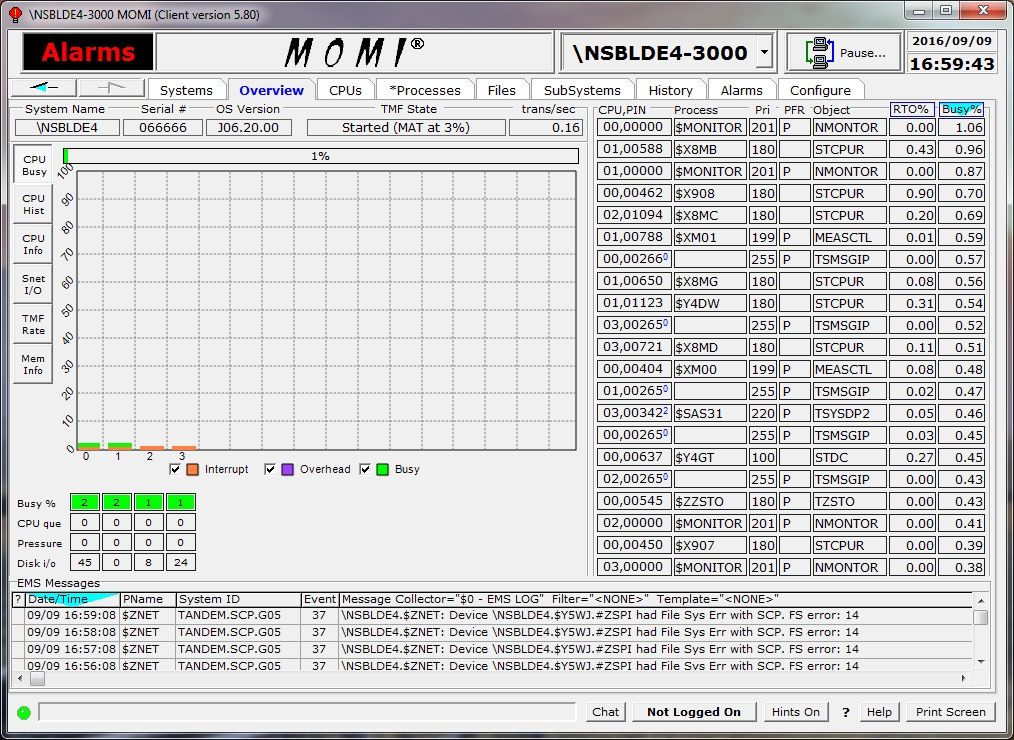
The Main Overview screen provides the launch point for general information about the health of the System.
The top left side of the screen contains the System name, System serial number and operating system version. The next two fields provide the state of TMF and the current transactions per second. The TMF State displays the percent utilization of the audit trail (largest value is displayed if TMF is configured with auxiliary audit trails).
The fields in the lower left handle corner Busy %, CPU que, Pressure and Disk I/O display the Overall CPU busy, average CPU queue depth, memory pressure (a value from 0 to 7 where 7 is the highest) and physical disk I/Os per second respectively. Additionally, these fields are used to relate special information as described below.
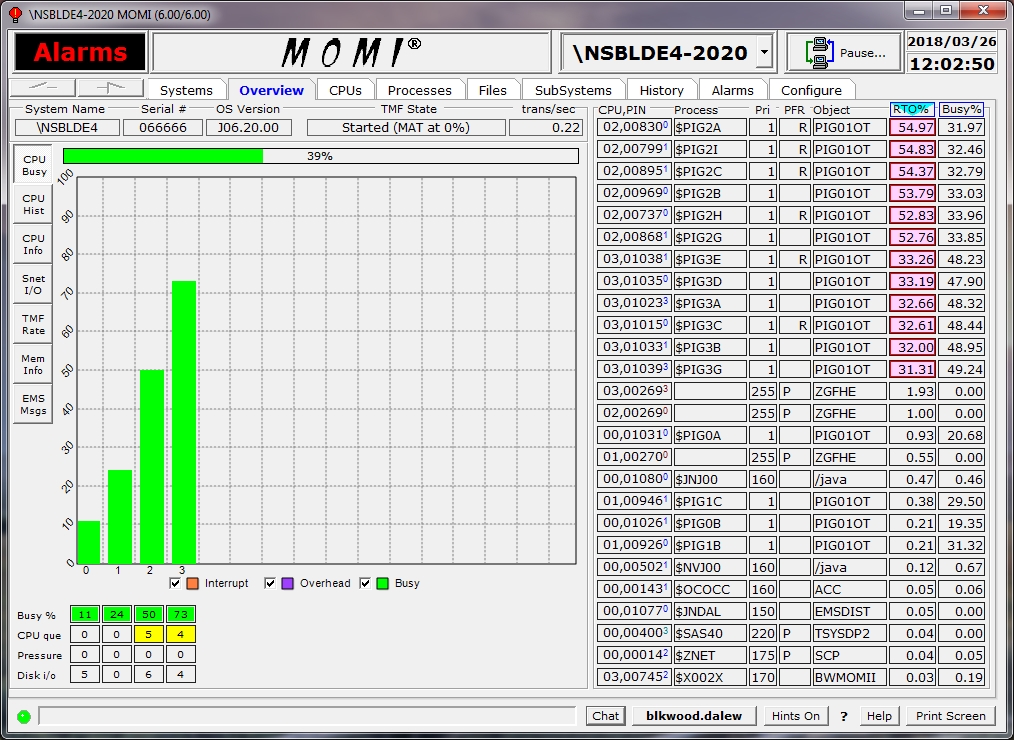
Information for the right side of the screen normally displays process and sorted by process busy percent. Right-click on the heading of the blank column to display process $RECEIVE Queue Length, the process Ready Time Only (RTO is the process Ready Time less Process Busy Time) or blank to restore an empty column. The selection displays and sorts by the chosen value. Click on the Busy% column to sort by process busy percent.
If MEASURE is not started, MEAS is reported in each affected processor. Use MEASCOM to start the MEASURE subsystem (for the system or a particular processor):
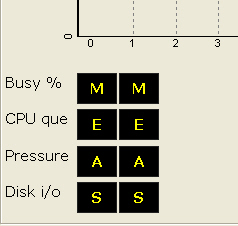
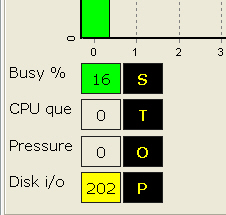
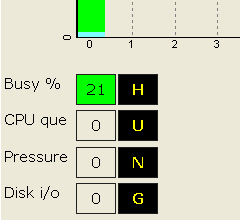
If a MOMI CPU collector process does not report in a timely manner, typically after 30 seconds, STOP is reported. MOMI then issues a Guardian stop on the collector process and the process is automatically restarted by MOMI (the automatic restart occurs approximately 1 minute after the STOP is displayed). Technically, the processor is marked as HUNG but this is usually not visible if the CPU collector process stops as directed:
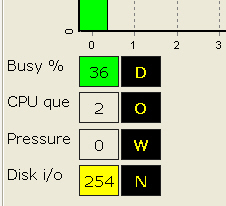
In the event a CPU fails, DOWN is reported for the affected CPU. MOMI automatically restarts a collector process approximately 1 minute after the CPU is reloaded:
Later versions of MOMI display a more prominent CPU / MOMI status (the text below are samples, real text appears over the affected CPU).
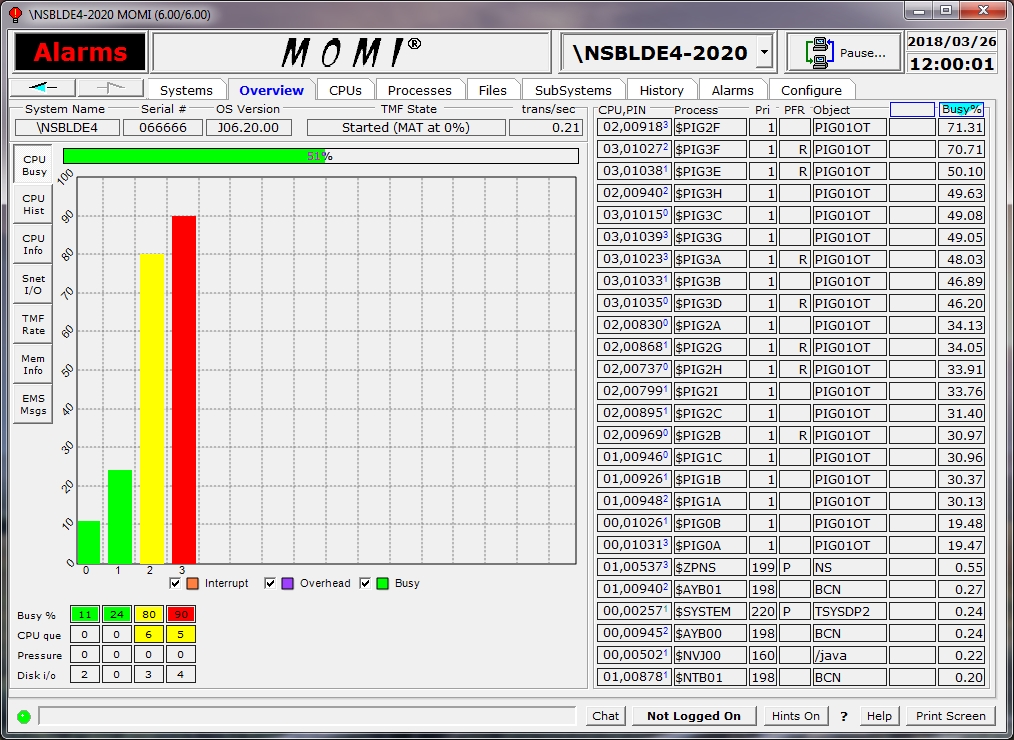
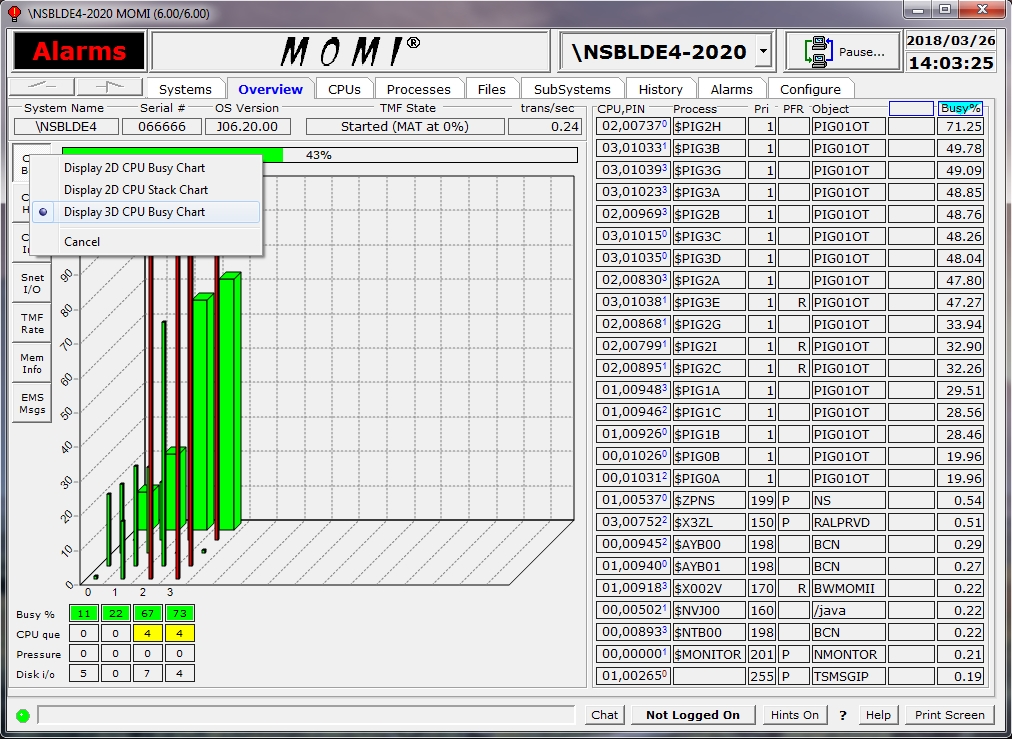
Additional CPU busy information is available for NonStop Blade and later Systems. Right-click on the CPU Busy button on the left hand side and select Display 3D CPU Busy Chart. This setting enables the display of individual IPU's (small narrow bar) along with the overall process busy (wide bar). Note that on the right side of the screen that it is possible for an individual process to be at (or near 100%) and yet the overall CPU busy is nowhere near 100%. A processes percent busy is based on its activity within an individual IPU as it may not span multiple IPUs. So, for example, if a CPU has four IPUs and a single process is running at 100% the total CPU busy reported is 25% (yes, it does take some getting used to).
TMF State reports the general status of TMF (Started, Stopped, etc...) along with overflow and other error indicators. The percentage full (i.e. in use) of the largest of the Master (MAT) or Auxiliary (AUXnn) audit trails is also reported in parentheses for most states. Generally speaking, the "worst" state or condition is selected for display.
Below are some sample TMF States:
![]() Master audit trail at 11% full
Master audit trail at 11% full
![]()
Auxiliary audit trail 1 at 33% full
![]() Auxiliary audit trail 1 at 77% full
Auxiliary audit trail 1 at 77% full
![]() Auxiliary audit trail 1 cannot rollover (out of space and no overflow available)
Auxiliary audit trail 1 cannot rollover (out of space and no overflow available)
![]() Auxiliary audit trail 1 using overflow
Auxiliary audit trail 1 using overflow
![]() Begin transactions disabled within TMF
Begin transactions disabled within TMF
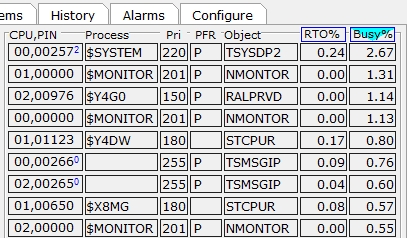
The right side of the screen shows the busiest or top processes on the entire System. The columns listed are the CPU, PIN [IPU], process name (blank if unnamed), current priority, PFR, Object file name, RTO% and Busy Percent.
The Busy% column is the percentage of total CPU busy for the process during the last monitored interval (by default MOMI scans the CPUs every 10 seconds). Note that for multiple IPU CPUs the percent busy represents the single IPU.
The RTO% column is a user selectable column that may display nothing, $RECEIVE Queue Time (average queue length), or Ready Time Only.
The screen may be sorted by clicking in either the RTO% or Busy% column.
The Object column displays the last portion of a Guardian or OSS executable file name
The PFR column indicate with single letter descriptors if the process is P - Privileged , F - page Faulting or R - on the Ready list. A process is Privileged if it has been granted authority to run without security limitations (many System processes are Privileged). A process needing memory space is page Faulting during the time it takes to free or swap needed memory pages. A process is on the Ready list when it is waiting for CPU execution. Additionally, a process can be on the Ready list while waiting on a page Fault.
The Pri column is the current process priority field. The surrounding box is yellow if the operating system has reduced the process priority and the process is a disk. A red color is used for any other process with a reduced priority. Disk processes will assume the priority of the requesting process while waiting for executing time. It is normal to see a disk process running at different priorities. User processes have their priority lowered by the System if they are determined to be CPU bound (i.e. taking a great deal of CPU resources).
The Process column displays the process $Name, a system special name (such as $MONITOR), or nothing to represent an unnamed process.
The CPU,PIN[IPU] column shows the processor number, process identification number and optionally the CPU core number (i.e. IPU) where the process is running. The IPU is displayed, by default, if it has been specifically assigned by the operating system or by the user. If the IPU is not displayed it is assumed to be floating or in other words the process is dispatched in any available CPU core.
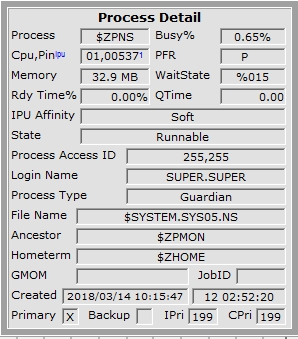
Placing the mouse over a CPU,PIN displays a pop-up window presenting additional information for that process. Below is a sample image:
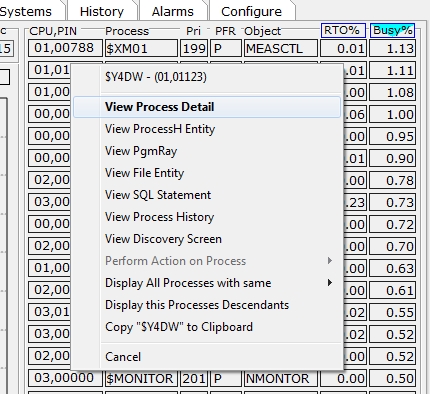
A right click on the CPU,PIN or Process field will bring up a menu allowing the User to select a variety of jumps or actions using the selected process (the actions available vary depending on the process):
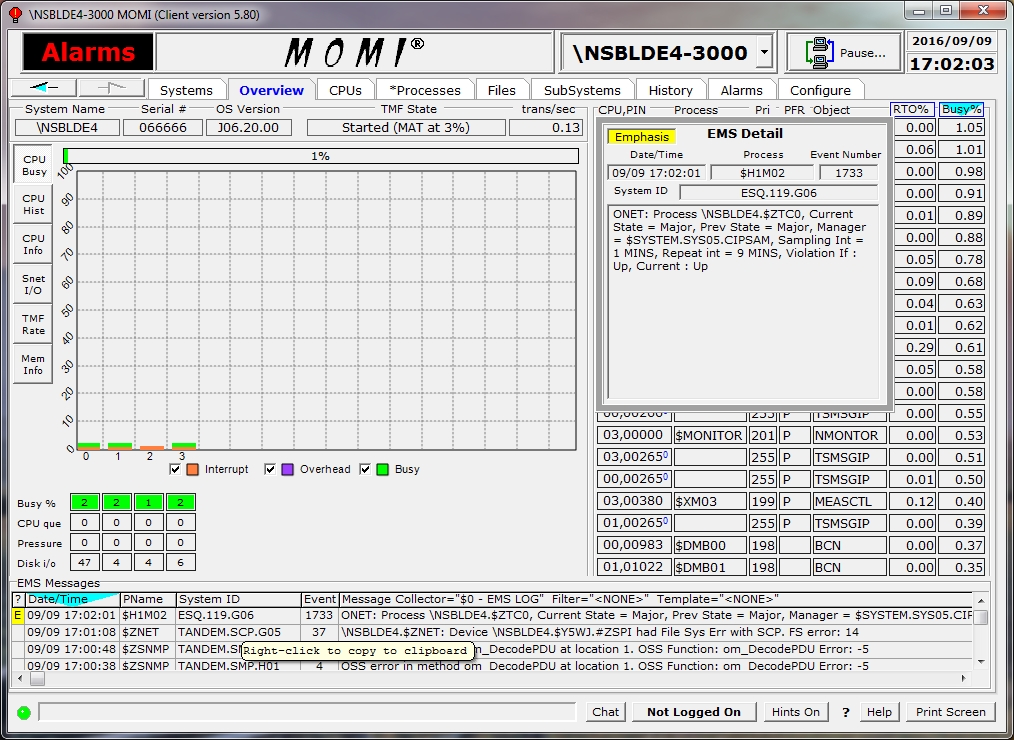
The Overview screen may also be configured, on the page Settings / Single Screen to an alternate format that displays EMS information along the bottom on the screen. Note that in this mode the EMS Msgs button along the left side is not longer present. To change the text size of the EMS messages, right-click on any EMS column heading and select Display Grid Tools... Note that space is limited on this screen so a large font selection will not normally work well.
Placing the mouse over an EMS message display a pop-up detail.